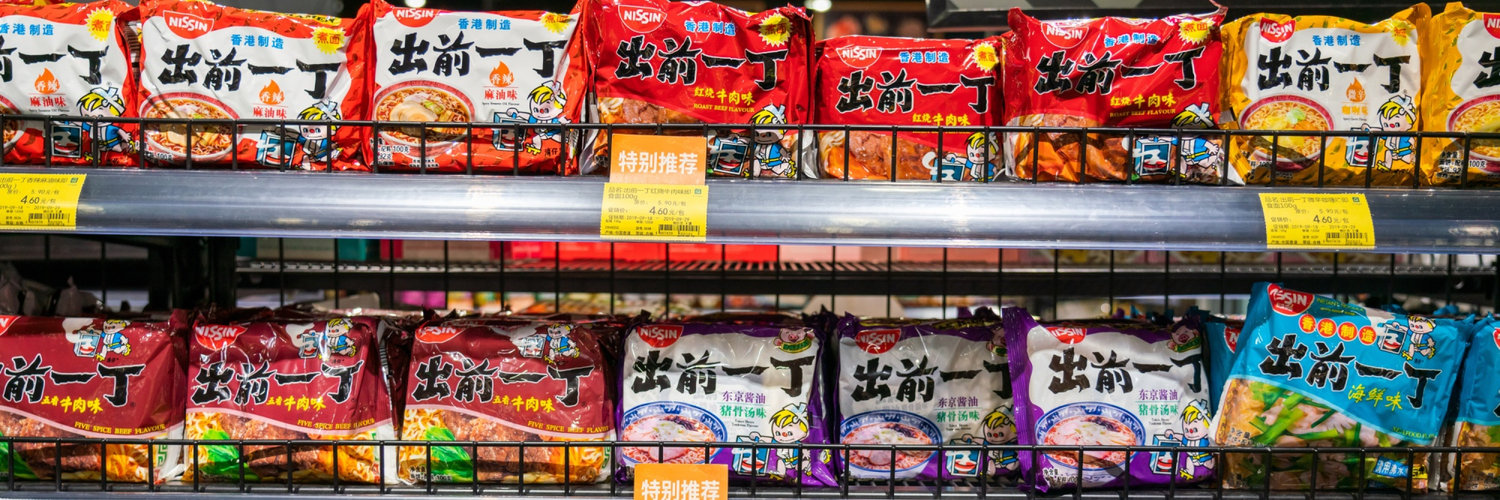
Nissin Foods Holdings Co Ltd
TSE:2897
Net Margin
Net Margin shows how much profit a company keeps from each dollar of sales after all expenses, including taxes and interest. It reflects the company`s overall profitability.
Net Margin shows how much profit a company keeps from each dollar of sales after all expenses, including taxes and interest. It reflects the company`s overall profitability.
Peer Comparison
| Country | Company | Market Cap |
Net Margin |
||
|---|---|---|---|---|---|
| JP |

|
Nissin Foods Holdings Co Ltd
TSE:2897
|
937.5B JPY |
Loading...
|
|
| JP |
G
|
Goyo Foods Industry Co Ltd
TSE:2230
|
53.2T JPY |
Loading...
|
|
| CH |

|
Nestle SA
SIX:NESN
|
199.8B CHF |
Loading...
|
|
| US |

|
Mondelez International Inc
NASDAQ:MDLZ
|
77.5B USD |
Loading...
|
|
| ZA |
T
|
Tiger Brands Ltd
JSE:TBS
|
57.1B ZAR |
Loading...
|
|
| FR |

|
Danone SA
PAR:BN
|
44.5B EUR |
Loading...
|
|
| US |

|
Hershey Co
NYSE:HSY
|
46.8B USD |
Loading...
|
|
| CN |

|
Muyuan Foods Co Ltd
SZSE:002714
|
255.1B CNY |
Loading...
|
|
| ZA |
A
|
Avi Ltd
JSE:AVI
|
36.3B ZAR |
Loading...
|
|
| CH |

|
Chocoladefabriken Lindt & Spruengli AG
SIX:LISN
|
27.4B CHF |
Loading...
|
|
| CN |

|
Foshan Haitian Flavouring and Food Co Ltd
SSE:603288
|
218B CNY |
Loading...
|
Market Distribution
| Min | -122 700% |
| 30th Percentile | 2.9% |
| Median | 5.4% |
| 70th Percentile | 8.5% |
| Max | 63 031.4% |
Other Profitability Ratios
Nissin Foods Holdings Co Ltd
Glance View
In the bustling landscape of global food manufacturing, Nissin Foods Holdings Co Ltd stands as a towering figure, pioneering the instant noodle industry since its inception in 1948 by the visionary Momofuku Ando. The company's origins trace back to Japan post-World War II, a time marked by food shortages and economic constraints. Ando’s innovation of the first instant noodle, Chikin Ramen, in 1958, revolutionized the way the world consumed quick meals. Nissin has since expanded its portfolio beyond just instant noodles to include a diverse range of food products. While the company’s heart remains with its flagship brand, Cup Noodles, it continually innovates, introducing healthier options and exploring new flavors to cater to the evolving tastes of consumers globally. As a multinational corporation, Nissin ingeniously capitalizes on both production and distribution to drive growth and profitability. Anchored by strategic factories across Asia, North America, and Europe, the company efficiently scales its operations to meet global demands. This extensive network not only reduces logistical costs but also allows Nissin to adapt quickly to local tastes and preferences, a crucial component of its business model. Moreover, by maintaining a robust marketing strategy that emphasizes convenience and affordability, coupled with collaborations with retailers and food service providers, Nissin ensures its iconic products are accessible to a wide audience. This strategy, underpinned by continuous product innovation and strategic market penetration, solidifies Nissin's position as an industry leader in the world of instant foods.
See Also
Net Margin is calculated by dividing the Net Income by the Revenue.
The current Net Margin for Nissin Foods Holdings Co Ltd is 6.5%, which is below its 3-year median of 7.1%.
Over the last 3 years, Nissin Foods Holdings Co Ltd’s Net Margin has increased from 6.1% to 6.5%. During this period, it reached a low of 6.1% on Dec 31, 2022 and a high of 8.5% on Sep 30, 2023.
